New-build housing in Portugal — November 2026
flatin.pt Data Team · published 2026-11-09
Portugal licensed 10 240 new-build dwellings in Jul–Sep 2026, +5% compared with the same period of 2025 (INE). A square metre of new housing sold for 2 476 € (median, 12 months to Q2 2026), +12% compared with existing homes.
The figures in this edition
-
10 240
new-build dwellings licensed, Jul–Sep 2026
+5% compared with the same period of 2025 (9 751 dwellings). INE, family housing.
Source: flatin.pt, 2026-11-09, based on INE — https://flatin.pt/en/report/new-build/2026-11/#f-licensing
# -
2 476 €
per m² — median sale price of new housing
Portugal, 12 months to Q2 2026. Existing homes: 2 208 € (+12%). INE.
Source: flatin.pt, 2026-11-09, based on INE — https://flatin.pt/en/report/new-build/2026-11/#f-price
# -
122
flatin construction barometer index (2022 = 100)
Building-works cases over 12 months to Aug 2026, +1% year on year. Fixed panel: Lisboa, Matosinhos.
Source: flatin.pt, 2026-11-09, based on municipal open data — https://flatin.pt/en/report/new-build/2026-11/#f-index
# -
241
developments with units for sale in the catalogue
2 516 units for sale in 35 municipalities; 447 developments in the catalogue. Checked up to 2026-11-09.
Source: flatin.pt, 2026-11-09 — https://flatin.pt/en/report/new-build/2026-11/#f-catalogue
# -
5 338 €
per m² — median asking price of units for sale
Entry price: 185 000 €. These are developers' asking prices, not sale prices. flatin.pt catalogue, 2026-11-09.
Source: flatin.pt, 2026-11-09 — https://flatin.pt/en/report/new-build/2026-11/#f-asking
# -
77%
dwellings completed per 100 licensed, 2023–2025 / 2021–2023
Portugal: 74 247 dwellings completed in 2023–2025, against 95 886 licensed in 2021–2023, 2 years earlier. INE, new buildings for family housing. Figures from 2024 on are INE estimates.
Source: flatin.pt, 2026-11-09, based on INE — https://flatin.pt/en/report/new-build/2026-11/#f-completion
# -
520 days
Lisboa: median days from application to permit, for permits issued in the last 12 months
409 days
Porto: median age of cases still in progress
Two different measures, not to be added up or compared. Municipal open data, captured on 2026-11-08.
Source: flatin.pt, 2026-11-09, based on municipal open data — https://flatin.pt/en/report/new-build/2026-11/#f-duration
#
Early signal: 69 602 energy pre-certificates for new housing in the 12 months to Sep 2026 (+13%; ADENE — SCE, mainland and Madeira). They are issued at design stage, before the licence.
What changed this month
- INE: 10 240 dwellings licensed in Jul–Sep 2026 (+5% year on year); in the October 2026 edition: 10 166 in Jun–Aug 2026.
- flatin.pt catalogue: 447 developments (+197 on October 2026) and 2 516 units for sale (+1 384).
- Barometer: index 122 to Aug 2026; in the October 2026 edition, 118 to Jul 2026.
- INE median for new housing: 2 476 € (Q2 2026); in the October 2026 edition, 2 402 € (Q1 2026).
Reading
In Porto, the 505 units for sale in the catalogue ask a median of 4 938 € per m² — +23% against the median sale price of new housing recorded by INE (4 005 €, Q2 2026). An asking price is not a sale price: the gap includes negotiation and the lag of the INE series, which covers 12 months of deeds.
Among the municipalities in this table, Porto saw the largest rise in licensing: 1 133 dwellings in Jul–Sep 2026, against 389 a year earlier (+191%).
flatin barometer: building-works cases over 12 months
Index, 2022 = 100, fixed panel (Lisboa, Matosinhos): each point sums the 12 months up to that month. Series captured on 2026-11-08.
By municipality
Municipalities with developments in the flatin.pt catalogue or with a barometer series. “—”: the source does not publish the value (INE suppresses medians with few sales) or no units are for sale.
| Municipality | Dwellings licensed, Jul–Sep 2026 | Year on year | Dwellings licensed, 2025 | €/m² new housing (INE, Q2 2026) | Developments in catalogue | With units for sale | Units for sale | From | €/m² asked (median) | Building-works cases, 12 months | Completed per 100 licensed (2023–2025 / 2021–2023) |
|---|---|---|---|---|---|---|---|---|---|---|---|
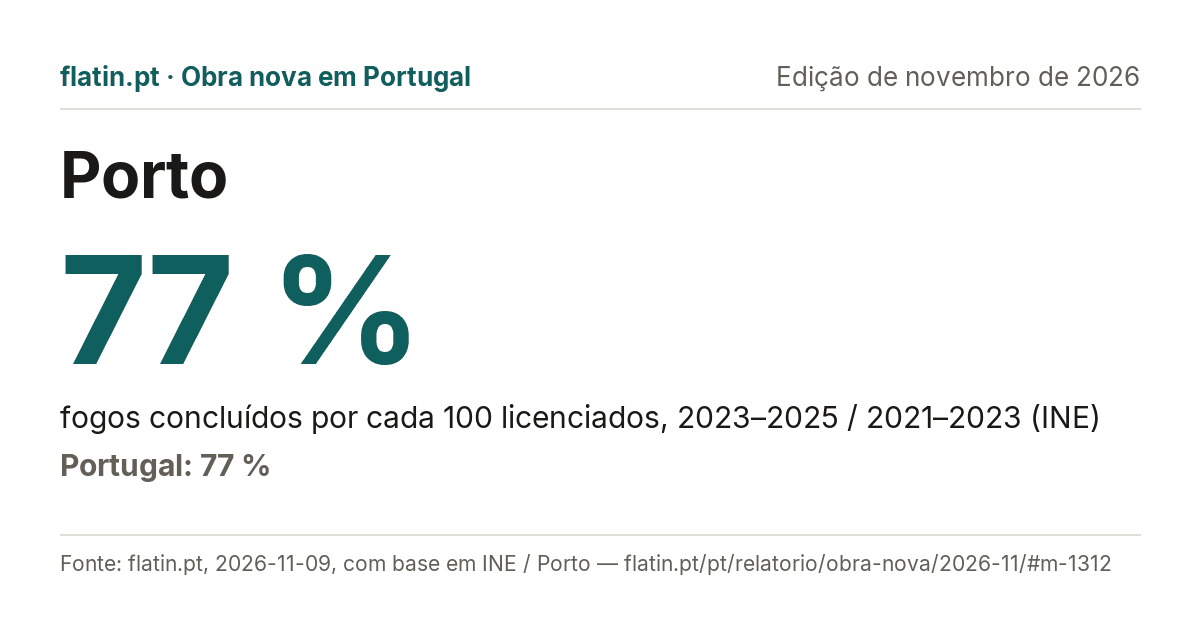
| Porto | 1 133 | +191% | 1 904 | 4 005 € | 77 | 59 | 505 | 185 000 € | 4 938 € | 436 | 77% |
| Lisboa | 82 | −1% | 1 170 | 6 434 € | 73 | 49 | 438 | 296 000 € | 8 627 € | 1 745 | 34% |
| Vila Nova de Gaia | 446 | −50% | 2 987 | 3 054 € | 49 | 28 | 381 | 195 000 € | 4 014 € | — | 69% |
| Matosinhos | 228 | +51% | 581 | 3 810 € | 31 | 21 | 169 | 190 000 € | 5 444 € | 270 | 69% |
| Cascais | 136 | +19% | 575 | 5 260 € | 29 | 14 | 127 | 335 000 € | 10 776 € | — | 87% |
| Oeiras | 174 | +96% | 809 | 4 819 € | 22 | 8 | 50 | 539 000 € | 7 777 € | — | 82% |
| Gondomar | 129 | −29% | 555 | 2 470 € | 16 | 11 | 225 | 222 000 € | 3 927 € | — | 80% |
| Maia | 265 | −24% | 1 115 | 2 739 € | 14 | 5 | 56 | 249 000 € | 3 645 € | — | 76% |
| Loures | 76 | −72% | 1 275 | 3 733 € | 9 | 3 | 90 | 430 500 € | 6 308 € | — | 74% |
| Loulé | 19 | −57% | 154 | 4 767 € | 8 | 2 | 6 | 680 000 € | 6 422 € | — | 72% |
| Vila do Conde | 188 | −4% | 732 | 2 244 € | 6 | 2 | 3 | 280 000 € | 3 276 € | — | 85% |
| Braga | 164 | +1% | 931 | 2 465 € | 6 | 2 | 44 | 227 000 € | 3 763 € | — | 78% |
| Portimão | 54 | +4% | 594 | 3 337 € | 6 | 0 | 0 | — | — | — | 47% |
| Albufeira | 171 | +2750% | 53 | 3 783 € | 5 | 2 | 30 | 375 000 € | 3 658 € | — | 74% |
| Lagoa (Algarve) | 17 | −51% | 132 | 3 776 € | 5 | 0 | 0 | — | — | — | 55% |
| Coimbra | 292 | +54% | 1 161 | 3 058 € | 4 | 0 | 0 | — | — | — | 103% |
| Leiria | 270 | +26% | 1 129 | 2 242 € | 4 | 3 | 23 | 204 750 € | 4 020 € | — | 91% |
| Setúbal | 126 | +448% | 250 | 3 119 € | 4 | 0 | 0 | — | — | — | 65% |
| Sintra | 80 | −69% | 1 073 | 3 226 € | 4 | 2 | 56 | 520 000 € | 6 741 € | — | 77% |
| Ponta Delgada | 32 | −50% | 282 | 2 428 € | 4 | 0 | 0 | — | — | — | 100% |
| Guimarães | 114 | −34% | 739 | 2 016 € | 3 | 0 | 0 | — | — | — | 73% |
| Seixal | 81 | −68% | 840 | 3 130 € | 3 | 3 | 17 | 305 000 € | 4 935 € | — | 101% |
| Paredes | 73 | −18% | 495 | 1 738 € | 3 | 1 | 8 | 280 000 € | 2 662 € | — | 100% |
| Montijo | 51 | +5000% | 156 | 2 850 € | 3 | 2 | 23 | 299 250 € | 4 332 € | — | 80% |
| Almada | 43 | +43% | 170 | 3 496 € | 3 | 1 | 11 | 755 000 € | 9 011 € | — | 88% |
| Faro | 43 | +59% | 77 | 3 929 € | 3 | 2 | 39 | 380 000 € | 3 813 € | — | 73% |
| Ourém | 39 | −55% | 218 | 1 569 € | 3 | 3 | 33 | 288 750 € | 3 362 € | — | 86% |
| Póvoa de Varzim | 38 | −62% | 238 | 2 623 € | 3 | 0 | 0 | — | — | — | 14% |
| Nazaré | 23 | −23% | 112 | 3 061 € | 3 | 2 | 28 | 400 000 € | 11 476 € | — | 84% |
| Penafiel | 112 | +37% | 317 | 1 648 € | 2 | 1 | 9 | 245 000 € | 2 720 € | — | 112% |
| Valongo | 67 | +458% | 79 | 2 362 € | 2 | 0 | 0 | — | — | — | 83% |
| Funchal | 54 | +135% | 349 | 3 963 € | 2 | 0 | 0 | — | — | — | 78% |
| Lagos | 11 | −15% | 210 | 4 153 € | 2 | 1 | 6 | 820 000 € | 4 417 € | — | 87% |
| Santarém | 9 | −74% | 260 | 1 572 € | 2 | 0 | 0 | — | — | — | 90% |
| Alcácer do Sal | 8 | −11% | 38 | 2 008 € | 2 | 2 | 32 | 275 000 € | 5 440 € | — | 75% |
| Alcochete | 7 | +75% | 67 | 3 046 € | 2 | 2 | 11 | 645 000 € | 3 831 € | — | 93% |
| Santiago do Cacém | 6 | −62% | 47 | 2 375 € | 2 | 2 | 25 | 310 000 € | 5 347 € | — | 65% |
| Espinho | 2 | −94% | 100 | 3 157 € | 2 | 0 | 0 | — | — | — | 57% |
| Viana do Castelo | 149 | +119% | 337 | 2 193 € | 1 | 0 | 0 | — | — | — | 62% |
| Barreiro | 142 | +468% | 108 | 3 266 € | 1 | 0 | 0 | — | — | — | 82% |
| Lousada | 123 | +180% | 292 | 1 580 € | 1 | 1 | 13 | 247 835 € | 2 158 € | — | 81% |
| Mafra | 98 | −16% | 657 | 3 017 € | 1 | 0 | 0 | — | — | — | 72% |
| Silves | 96 | +773% | 57 | 2 812 € | 1 | 1 | 2 | 995 000 € | — | — | 88% |
| Palmela | 84 | +31% | 213 | 2 366 € | 1 | 0 | 0 | — | — | — | 90% |
| Ovar | 64 | +33% | 253 | 1 974 € | 1 | 0 | 0 | — | — | — | 74% |
| Grândola | 62 | +82% | 148 | 2 331 € | 1 | 0 | 0 | — | — | — | 81% |
| Vila Real | 62 | +226% | 190 | 2 213 € | 1 | 0 | 0 | — | — | — | 28% |
| Pombal | 52 | +18% | 233 | 1 626 € | 1 | 1 | 1 | 298 500 € | — | — | 80% |
| Cantanhede | 45 | −20% | 190 | 1 489 € | 1 | 0 | 0 | — | — | — | 86% |
| Esposende | 40 | +33% | 123 | 2 600 € | 1 | 0 | 0 | — | — | — | 74% |
| Oliveira de Azeméis | 37 | +118% | 91 | 1 580 € | 1 | 0 | 0 | — | — | — | 77% |
| Sesimbra | 36 | −20% | 169 | 3 187 € | 1 | 0 | 0 | — | — | — | 46% |
| Lourinhã | 33 | −28% | 172 | 2 029 € | 1 | 0 | 0 | — | — | — | 90% |
| Sertã | 29 | +26% | 41 | — | 1 | 0 | 0 | — | — | — | 43% |
| Tavira | 29 | +625% | 83 | 3 438 € | 1 | 1 | 17 | 600 000 € | 6 408 € | — | 109% |
| Moita | 28 | +100% | 100 | 2 699 € | 1 | 0 | 0 | — | — | — | 96% |
| Figueira da Foz | 27 | −60% | 297 | 2 262 € | 1 | 1 | 1 | 445 000 € | — | — | 96% |
| Entroncamento | 20 | +122% | 124 | 1 743 € | 1 | 1 | 2 | 240 000 € | — | — | 81% |
| Santa Cruz | 17 | −6% | 64 | 2 929 € | 1 | 0 | 0 | — | — | — | 76% |
| Trofa | 8 | −90% | 148 | 2 083 € | 1 | 1 | 14 | 225 000 € | 2 728 € | — | 97% |
| Penalva do Castelo | 3 | −25% | 12 | — | 1 | 0 | 0 | — | — | — | 92% |
| Sines | 3 | −96% | 104 | — | 1 | 1 | 21 | 230 000 € | 6 500 € | — | 92% |
| Castro Marim | 1 | −75% | 19 | 3 423 € | 1 | 0 | 0 | — | — | — | 68% |
| São João da Madeira | 0 | −100% | 15 | 2 083 € | 1 | 0 | 0 | — | — | — | 136% |
| Lousã | 8 | −75% | 52 | 1 198 € | 0 | 0 | 0 | — | — | 27 | 105% |
| Portugal | 10 240 | +5% | 42 066 | 2 476 € | 447 | 241 | 2 516 | 185 000 € | 5 338 € | — | 77% |
Methodology and sources
- INE, indicator 0012098 — dwellings licensed in new buildings for family housing, 3-month sum (this edition's window: Jul–Sep 2026; updated by INE on 2026-11-09). The comparison is with the same window a year earlier. Windows ending in January or February are not used in the headline: in 2026 INE published them as year-to-date totals, not as 3 months (INE corrected them on 9 October 2026).
- INE, indicator 0013235 — dwellings licensed in new buildings for family housing, year 2025.
- INE, indicator 0012234 — median value per m² of sales of new and existing family dwellings, 12 months ending in Q2 2026. INE does not publish the median for municipalities with few sales.
- flatin.pt catalogue — published developments; units for sale: active, available and priced, reconfirmed at the source within the last 14 days when the source is a listing. Asking prices, not sale prices. A municipality's median per m² is shown from 3 units. Latest check: 2026-11-09.
- flatin barometer — building-works cases entering municipalities with open data (series captured on 2026-11-08); fixed-panel index. Cases are neither licences nor dwellings.
- ADENE — SCE: energy pre-certificates for new housing, as context only; they are not part of this page's dataset.
- Each edition's figures are frozen on the publication date (2026-11-09). Later revisions by the sources go into the next edition.
- Published monthly, from the 8th of each month, after INE's monthly release on building permits.
- flatin.pt is published by HOLY CHAOS, UNIPESSOAL LDA (AMI licence no. 28163), a licensed estate agency. INE figures appear exactly as INE publishes them.
How the barometer is calculated
How to cite
flatin.pt (2026). New-build housing in Portugal — November 2026. https://flatin.pt/en/report/new-build/2026-11/
Data for this edition
Table by municipality and national figures, in CSV and JSON, under CC BY 4.0: you may reuse them as long as you credit the source with a link to flatin.pt. ADENE figures are not included.
CSV · JSON · List of editions (JSON)
A PNG card for each municipality, to share (1200 × 630, in Portuguese). Example: Porto
Embed the chart
Copy the code into your site: the image is fixed to this edition and carries the link to the report.
<a href="https://flatin.pt/en/report/new-build/2026-11/"><img src="https://flatin.pt/api/v1/reports/obra-nova/2026-11/chart.svg?lang=en" alt="flatin construction barometer index — November 2026" width="1064" height="380" style="max-width:100%;height:auto"></a>Press release for this edition
You may copy and reuse these figures as long as you credit the source with a link to flatin.pt. Terms of use